You have some experience working with R already. You should have written a number of functions, and be comfortable with R’s basic data structures (vectors, matrices, arrays, lists, and data frames).
You will learn from…
The workshop is taught by Garrett Grolemund. Garrett is the Editor-in-Chief of shiny.rstudio.com, the development center for the Shiny R package. He is also the author of Hands-On Programming with R as well as Data Science with R, a forthcoming book by O’Reilly Media. Garrett works as a Data Scientist and Chief Instructor for RStudio, Inc. GitHub
To leave a comment for the author, please follow the link and comment on his blog: RStudio Blog.
One issue is that each of these approaches requires working outside of R to obtain the data (in the case of the Data Explorer, it also requires knowledge of SQL). I’ve thus created the stackr package, which can query the Stack Exchange API to obtain information on questions, answers, users, tags, etc, and converts the output into an R data frame that can easily be manipulated, analyzed, and visualized. (Hadley Wickham’s httr package, along his terrific guide for writing an API package, helped a lot!) stackr provides the tools to perform analyses of a particular user, of recently asked questions, of a particular tag, or of other facets of the site.
The package is straightforward to use. Every function starts with stack_: stack_answers to query answers, stack_questions for questions, stack_users, stack_tags, and so on. Each output is a data frame, where each row represents one object (an answer, question, user, etc). The package also provides features for sorting and filtering results in the API: almost all the features available in the API itself. Since the API has an upper limit of returning 100 results at a time, the package also handles pagination so you can get as many results as you need.
Example: answering activity
Here I’ll show an example of using the stackr package to analyze an individual user. We’ll pick one at random: eeny, meeny, miny… me. (OK, that might not have been random). Stack Overflow provides many summaries and analyses on that profile already, but the stackr package lets us bring the data seamlessly into R so we can analyze it however we want. Extracting all of my answers is done using the stack_users function with the extra argument "answers". We’ll take advantage of stackr’s pagination feature, and turn the result into a tbl_df from dplyr so that it prints more reasonably:
Well, it looks like my activity has been decreasing over time (though I already knew that). How about how my answering activity changes over the course of a day?
(Note that the times are in my own time zone, EST). Unsurprisingly, I answer more during the day than at night, but I’ve still done some answering even around 4-6 AM. You can also spot two conspicuous dips: one at 12 when I eat lunch, and one at 6 when I take the train home from work.
(If that’s not enough invasion of my privacy, you could look at my commenting activity with stack_users(712603, "comments", ...), but it generally shows the same trends).
Top tags
The API also makes it easy to extract the tags I’ve most answered, which is another handy way to extract and visualize information about my answering activity:
This is just scratching the surface of the information that the API can retrieve. Hopefully the stackr package will make possible other analyses, visualizations, and Shiny apps that help understand and interpret Stack Exchange data.
To leave a comment for the author, please follow the link and comment on his blog: Variance Explained.
A new package of mine just got to CRAN in its very first version 0.0.1: drat. Its name stands for drat R Archive Template, and an introduction is provided at the drat page, the GitHub repository, and below.
drat builds on a core strength of R: the ability to query multiple repositories. Just how one could always query, say, CRAN, BioConductor and OmegaHat---one can now adds drats of one or more other developers with ease. drat also builds on a core strength of GitHub. Every user automagically has a corresponding github.io address, and by appending drat we are getting a standardized URL.
drat combines both strengths. So after an initial install.packages("drat") to get drat, you can just do either one of
library(drat)
addRepo("eddelbuettel")
or equally
drat:::add("eddelbuettel")
to register my drat. Now install.packages() will work using this new drat, as will update.packages(). The fact that the update mechanism works is a key strength: not only can you get a package, but you can gets its updates once its author replaces them into his drat.
How does one do that? Easy! For a package foo_0.1.0.tar.gz we do
library(drat)
insertPackage("foo_0.1.0.tar.gz")
The default git repository locally is taken as the default ~/git/drat/ but can be overriden as both a local default (via options()) or directly on the command-line. Note that this also assumes that you a) have a gh-pages branch and b) have that branch as the currently active branch. Automating this / testing for this is left for a subsequent release. Also available is an alternative unexported short-hand function:
show here with the alternate use case of a local fileshare you can copy into and query from---something we do at work where we share packages only locally.
The easiest way to obtain the corresponding file system layout may be to just fork the drat repository.
So that is it. Two exported functions, and two unexported (potentially name-clobbering) shorthands. Now drat away!
Courtesy of CRANberries, there is also a copy of the DESCRIPTION file for this initial release. More detailed information is on the drat page.
The Australasian Data Mining Conference has established itself as the premier Australasian meeting for both practitioners and researchers in data mining. It is devoted to the art and science of intelligent analysis of (usually big) data sets for meaningful (and previously unknown) insights. This conference will enable the sharing and learning of research and progress in the local context and new breakthroughs in data mining algorithms and their applications across all industries.
Publication and topics
We are calling for papers, both research and applications, and from both academia and industry, for presentation at the conference. All papers will go through double-blind, peer-review by a panel of international experts. Accepted papers will be published in an up-coming volume (Data Mining and Analytics 2015) of the Conferences in Research and Practice in Information Technology (CRPIT) series by the Australian Computer Society which is also held in full-text on the ACM Digital Library and will also be distributed at the conference. For more details on CRPIT please see http://www.crpit.com. Please note that we require that at least one author for each accepted paper will register for the conference and present their work. AusDM invites contributions addressing current research in data mining and knowledge discovery as well as experiences, novel applications and future challenges.
Topics of interest include, but are not restricted to:
– Applications and Case Studies – Lessons and Experiences
– Big Data Analytics
– Biomedical and Health Data Mining
– Business Analytics
– Computational Aspects of Data Mining
– Data Integration, Matching and Linkage
– Data Mining Education
– Data Mining in Security and Surveillance
– Data Preparation, Cleaning and Preprocessing
– Data Stream Mining
– Evaluation of Results and their Communication
– Implementations of Data Mining in Industry
– Integrating Domain Knowledge
– Link, Tree, Graph, Network and Process Mining
– Multimedia Data Mining
– New Data Mining Algorithms
– Professional Challenges in Data Mining
– Privacy-preserving Data Mining
– Spatial and Temporal Data Mining
– Text Mining
– Visual Analytics
– Web and Social Network Mining
Submission of papers
We invite two types of submissions for AusDM 2015:
– Academic submissions: Normal academic submissions reporting on research progress, with a paper length of between 8 and 12 pages in CRPIT style, as detailed below. Academic submissions we will use a double-blinded review process, i.e. paper submissions must NOT include authors names or affiliations (and also not acknowledgements referring to funding bodies). Self-citing references should also be removed from the submitted papers (they can be added on after the review) for the double blind reviewing purpose.
– Industry submissions: Submissions from governments and industry can report on specific data mining implementations and experiences. Submissions in this category can be between 4 and 8 pages in CRPIT style, as detailed below. These submissions do not need to be double-blinded. A special committee made of industry representatives will assess industry submissions.
Paper submissions are required to follow the general format specified for papers in the CRPIT series by the Australian Computer Society. Submission details are available from http://crpit.com/AuthorsSubmitting.html.
Important Dates Submission of full papers: Monday 20 April 2015 (midnight PST)
Notification of authors: Sunday June 7 2015
Final version and author registration: Sunday June 28 2015
Conference: 8-9 August 2015
To leave a comment for the author, please follow the link and comment on his blog: blog.RDataMining.com.
Nothing has gotten more attention in the visualization world like the map-based insights, or in other words, just plotting on a map different KPIs to allow for a playful discovery experience. I must admit, maps are cool, an awesome tool to “show-off” and to visually gain some insights.
But let’s be also clear about the limitations of map based charts:
You can compare locations based on a KPI, but you cannot quantify the difference between them
Color is difficult to understand and often leads to misinterpretation (e.g: what’s the meaning of red? more sales? or worst results?).
Color gradients are also pretty challenging for the human eye.
Zooming in/out results in insights detailing down/aggregation, but it’s difficult to establish a quantification between different granularity levels.
Anyways, R can be really useful to create high-quality maps… There are awesome packages like rMaps, where you have a set of controls available to make your maps interactive, rgooglemaps, maptools, etc.
In this post I’m going to plot weather KPIs for over 8K different postal codes (Postleitzahl or PLZ) in Germany. I’m going to shade the different areas according to their values -as you would expect –
We are going to follow these steps to visualize the temperature, the humidity and the snow fall for the entire German country:
Preparation of the required assets (PLZ coordinates, polygon lines, weather API key, etc)
Querying the weather API for each PLZ to retrieve the weather values
Map creation and PLZ data frame merging with the obtained weather information
Map display for the weather metrics and high-resolution picture saving
1- Assets preparation
We need to prepare a few assets… Everything freely accessible and just a mouse click away… Amazing, isn’t it?
The list of all PLZ with city name and the lat/long coordinates of a centroid (you can download this data from geonames)
The shapefiles for the PLZ to know how to draw them on a map (kindly made available out of the OpenStreetMaps at suche-postleitzahl.org)
A key for the weather API (you need to register at openweathermap.org, takes literally a second and they are not going to bother you with newsletters)
2-Downloading the weather data
Basically, it’s just a JSON call we can perform for each PLZ passing the lat/long coordinates to the openweather api’s endpoint. Each weather entry is then stored as a 1 row data frame we keep appending to the one holding all entries:
library(jsonlite)#load the plz info you download from the geonames resource
plz.ort.de<-read.csv(file="../plzgeo.csv")
weather.de<-NULL
for(i in1:nrow(plz.ort.de)){
url<-paste0('http://api.openweathermap.org/data/2.5/weather?lat=',plz.ort.de[i,]$lat, '&lon=',plz.ort.de[i,]$lon,'&units=metric&APPID=PUT_YOUR_KEY_HERE')
weather.entry<-jsonlite::fromJSON(url,simplifyMatrix =F,simplifyDataFrame =F,flatten =T)
temperature<-weather.entry$main$temp
humidity<-weather.entry$main$humidity
wind.speed<-weather.entry$wind$speed
wind.deg<-weather.entry$wind$deg
snow<-weather.entry$snow$`3h`
if(is.null(wind.speed)){ wind.speed<-NA}if(is.null(wind.deg)){ wind.deg<-NA}if(is.null(snow)){ snow<-NA}if(is.null(humidity)){ humidity<-NA}if(is.null(temperature)){ temperature<-NA}
weather.de<-rbind(data.frame(plz=plz.ort.de[i,]$plz,temperature,humidity,wind.speed,wind.deg,snow),weather.de)#you might want to take your process to sleep for some milliseconds to give the API a breath}
3-Map creation and PLZ-weather data frames merging
Using the rgal for the required spatial transformations. In this case, we use the EPSG 4839 for the German geography (see spTransform)
You probably feel like having a map as reference to see city names, roads, rivers and all that stuff in each PLZ. For that we can use ggmap, a really cool package for spatial visualization with Google Maps and OpenStreetMap.
library(plyr)library(ggmap)# reading the shapes
area <- readOGR(dsn=".", layer="plz-gebiete")# using the normalized version with "0" for the later join
weather.de$plz<-weather.de$cplz
# from factor to character
area.df$plz<-as.character(area.df$plz)
area.df<-data.frame(id=rownames(area@data), area@data)# merging weather and geographical information
area.extend<-merge(area.df, weather.de, by=c("plz"),all=F)# building
area.points<- fortify(area)
area.points<-merge(area.points, area.extend, by=c("id"),all=F)
d <- join(area.points, area.extend, by="id")# region extraction
d$region<-substr(d$plz, 1,1)
bavaria<-subset(d, region=="8")# google map tiles request... location is where you want your map centered at
google.map<- get_map(location="Friedberg", zoom =8, maptype ="terrain", color ="bw", scale=4)
ggmap(google.map)+
geom_polygon(data=bavaria, aes(x=long, y=lat, group=group, fill=temperature), colour=NA, alpha=0.5)+
scale_fill_gradient2(low ="blue", mid ="yellow", high ="green",
midpoint =0, space ="Lab", na.value="lightgray", guide ="legend")+ theme(axis.text=element_blank())+
labs(fill="")+
theme_nothing(legend=TRUE)
ggsave("../plz-temperature-Bavaria.png", width=22.5, height=18.25, dpi=300)
The results speak for themselves! Temperature in Germany Temperature in the area around Munich only Snow across Germany
To leave a comment for the author, please follow the link and comment on his blog: Big Data Doctor » R.
Don’t waist another second, start parallelizing your computations today! The image is CC by Smudge 9000
Today is a good day to start parallelizing your code. I’ve been using the parallel package since its integration with R (v. 2.14.0) and its much easier than it at first seems. In this post I’ll go through the basics for implementing parallel computations in R, cover a few common pitfalls, and give tips on how to avoid them.
The common motivation behind parallel computing is that something is taking too long time. For me that means any computation that takes more than 3 minutes – this because parallelization is incredibly simple and most tasks that take time are
/wiki/Embarrassingly_parallel">embarrassingly parallel. Here are a few common tasks that fit the description:
Bootstrapping
Cross-validation
Multivariate Imputation by Chained Equations (MICE)
Fitting multiple regression models
Learning lapply is key
One thing I regret is not learning earlier lapply. The function is beautiful in its simplicity: It takes one parameter (a vector/list), feeds that variable into the function, and returns a list:
The tasks are
/wiki/Embarrassingly_parallel">embarrassingly parallel as the elements are calculated independently, i.e. second element is independent of the result from the first element. After learning to code using lapply you will find that parallelizing your code is a breeze.
The parallel package
The parallel package is basically about doing the above in parallel. The main difference is that we need to start with setting up a cluster, a collection of “workers” that will be doing the job. A good number of clusters is the numbers of available cores – 1. I’ve found that using all 8 cores on my machine will prevent me from doing anything else (the computers comes to a standstill until the R task has finished). I therefore always set up the cluster as follows:
On Mac/Linux you have the option of using makeCluster(no_core, type="FORK") that automatically contains all environment variables (more details on this below). On Windows you have to use the Parallel Socket Cluster (PSOCK) that starts out with only the base packages loaded (note that PSOCK is default on all systems). You should therefore always specify exactly what variables and libraries that you need for the parallel function to work, e.g. the following fails:
cl<-makeCluster(no_cores)
base <-2
clusterExport(cl, "base")
parLapply(cl,
2:4,
function(exponent)
base^exponent)
stopCluster(cl)
[[1]]
[1] 4

[[2]]
[1] 8

[[3]]
[1] 16
Note that you need the clusterExport(cl, "base") in order for the function to see the base variable. If you are using some special packages you will similarly need to load those through clusterEvalQ, e.g. I often use the rms package and I therefore use clusterEvalQ(cl, library(rms)). Note that any changes to the variable after clusterExport are ignored:
cl<-makeCluster(no_cores)
clusterExport(cl, "base")
base <-4# Run
parLapply(cl,
2:4,
function(exponent)
base^exponent)# Finish
stopCluster(cl)
[[1]]
[1] 4

[[2]]
[1] 8

[[3]]
[1] 16
Using parSapply
Sometimes we only want to return a simple value and directly get it processed as a vector/matrix. The lapply version that does this is called sapply, thus it is hardly surprising that its parallel version is parSapply:
The idea behind the foreach package is to create ‘a hybrid of the standard for loop and lapply function’ and its ease of use has made it rather popular. The set-up is slightly different, you need “register” the cluster as below:
The foreach function can be viewed as being a more controlled version of the parSapply that allows combining the results into a suitable format. By specifying the .combine argument we can choose how to combine our results, below is a vector, matrix, and a list example:
Note that the last is the default and can be achieved without any tweaking, just foreach(exponent = 2:4) %dopar%. In the example it is worth noting the .multicombine argument that is needed to avoid a nested list. The nesting occurs due to the sequential .combine function calls, i.e. list(list(result.1, result.2), result.3):
test <-function(exponent){
foreach(exponent =2:4,
.combine=c)%dopar%
base^exponent
}
test()
Error in base^exponent : task 1 failed - "object 'base' not found"
A nice feature is that you can use the .export option instead of the clusterExport. Note that as it is part of the parallel call it will have the latest version of the variable, i.e. the following change in “base” will work:
base <-2
cl<-makeCluster(2)
registerDoParallel(cl)
base <-4
test <-function(exponent){
foreach(exponent =2:4,
.combine=c,
.export="base")%dopar%
base^exponent
}
test()
stopCluster(cl)
[1] 4 8 16
Similarly you can load packages with the .packages option, e.g. .packages = c("rms", "mice"). I strongly recommend always exporting the variables you need as it limits issues that arise when encapsulating the code within functions.
Fork or sock?
I do most of my analyses on Windows and have therefore gotten used to the PSOCK system. For those of you on other systems you should be aware of some important differences between the two main alternatives:
FORK: "to divide in branches and go separate ways"
Systems: Unix/Mac (not Windows)
Environment: Link all
PSOCK: Parallel Socket Cluster
Systems: All (including Windows)
Environment: Empty
Memory handling
Unless you are using multiple computers or Windows or planning on sharing your code with someone using a Windows machine, you should try to use FORK (I use capitalized due to the makeClustertype argument). It is leaner on the memory usage by linking to the same address space. Below you can see that the memory address space for variables exported to PSOCK are not the same as the original:
library(pryr)# Used for memory analyses
cl<-makeCluster(no_cores)
clusterExport(cl, "a")
clusterEvalQ(cl, library(pryr))
parSapply(cl, X =1:10, function(x){address(a)})== address(a)
b <-0
parSapply(cl, X =1:10, function(x){b <- b +1; b})# [1] 1 1 1 1 1 1 1 1 1 1
parSapply(cl, X =1:10, function(x){b <<- b +1; b})# [1] 1 2 3 4 5 1 2 3 4 5
b
# [1] 0
Debugging
Debugging is especially hard when working in a parallelized environment. You cannot simply call browser/cat/print in order to find out what the issue is.
The tryCatch – list approach
Using stop() for debugging without modification is generally a bad idea; while you will receive the error message, there is a large chance that you have forgotten about that stop(), and it gets evoked once you have run your software for a day or two. It is annoying to throw away all the previous successful computations just because one failed (yup, this is default behavior of all the above functions). You should therefore try to catch errors and return a text explaining the setting that caused the error:
foreach(x=list(1, 2, "a"))%dopar%{tryCatch({c(1/x, x, 2^x)}, error =function(e)return(paste0("The variable '", x, "'",
" caused the error: '", e, "'")))}
[[1]]
[1] 1 1 2

[[2]]
[1] 0.5 2.0 4.0

[[3]]
[1] "The variable 'a' caused the error: 'Error in 1/x: non-numeric argument to binary operatorn'"
This is also why I like lists, the .combine may look appealing but it is easy to manually apply and if you have function that crashes when one of the element is not of the expected type you will loose all your data. Here is a simple example of how to call rbind on a lapply output:
starting worker pid=7392 on localhost:11411 at 00:11:21.077
starting worker pid=7276 on localhost:11411 at 00:11:21.319
starting worker pid=7576 on localhost:11411 at 00:11:21.762
[1] 2]

[1] "a"
As you can see due to a race between first and the second node the output is a little garbled and therefore in my opinion less useful than returning a custom statement.
Creating a node-specific file
A perhaps slightly more appealing alternative is to a have a node-specific file. This could potentially be interesting when you have a dataset that is causing some issues and you want to have a closer look at that data set:
A tip is to combine this with your tryCatch – list approach. Thereby you can extract any data that is not suitable for a simple message (e.g. a large data.frame), load that, and debug it without parallel. If the x is too long for a file name I suggest that you use digest as described below for the cache function.
The partools package
There is an interesting package partools that has a dbs() function that may be worth looking into (unless your on a Windows machine). It allows coupling terminals per process and debugging through them.
Caching
I strongly recommend implementing some caching when doing large computations. There may be a multitude of reasons to why you need to exit a computation and it would be a pity to waist all that valuable time. There is a package for caching, R.cache, but I’ve found it easier to write the function myself. All you need is the built-in digest package. By feeding the data + the function that you are using to the digest() you get an unique key, if that key matches your previous calculation there is no need for re-running that particular section. Here is a function with caching:
system.time(out <- cacheParallel())# user system elapsed# 0.003 0.001 5.079
out
# [1] 1 4system.time(out <- cacheParallel())# user system elapsed# 0.001 0.004 0.046
out
# [1] 1 4# To clean up the files just do:file.remove(list.files(pattern ="Cache.+\.Rdata"))
Load balancing
Balancing so that the cores have similar weight load and don’t fight for memory resources is core for a successful parallelization scheme.
Work load
Note that the parLapply and foreach are wrapper functions. This means that they are not directly doing the processing the parallel code, but rely on other functions for this. In the parLapply the function is defined as:
Note the splitList(X, length(cl)). This will split the tasks into even portions and send them onto the workers. If you have many of those cached or there is a big computational difference between the tasks you risk ending up with only one cluster actually working while the others are inactive. To avoid this you should when caching try to remove those that are cached from the X or try to mix everything into an even workload. E.g. if we want to find optimal number of neurons in a neural network we may want to change:
# From the nnet example
parLapply(cl, c(10, 50, 30, 40, 20), function(neurons)
  nnet(ir[samp,], targets[samp,],
       size = neurons))
Memory load
Running large datasets in parallel can quickly get you into trouble. If you run out of memory the system will either crash or run incredibly slow. The former happens to me on Linux systems while the latter is quite common on Windows systems. You should therefore always monitor your parallelization to make sure that you aren’t too close to the memory ceiling.
Using FORKs is an important tool for handling memory ceilings. As they link to the original variable address the fork will not require any time for exporting variables or take up any additional space when using these. The impact on performance can be significant (my system has 16Gb of memory and eight cores):
> cl <- makeCluster(8, type ="PSOCK")>system.time(clusterExport(cl, "a"))
user system elapsed
10.5761.26315.877>system.time(parSapply(cl, 1:8, function(x)mean(a +1)))
Error in checkForRemoteErrors(val):8 nodes produced errors; first error: cannot allocate vector of size 1.5 Gb
Timing stopped at:0.00400.389> stopCluster(cl)> cl <- makeCluster(8, type ="FORK")>system.time(parSapply(cl, 1:8, function(x)mean(a +1)))
user system elapsed
0.0140.0163.735> stopCluster(cl)
Although, it won’t save you from yourself as you can see below when we create an intermediate variable that takes up storage space:
> a <-matrix(1, ncol=10^4*2.1, nrow=10^4)> cl <- makeCluster(8, type ="FORK")> parSapply(cl, 1:8, function(x){+ b <- a +1+mean(b)+})
Error inunserialize(node$con): error reading from connection
Memory tips
Frequently use rm() in order to avoid having unused variables around
Frequently call the garbage collector gc(). Although this should be implemented automatically in R, I’ve found that while it may releases the memory locally it may not return it to the operating system (OS). This makes sense when running at a single instance as this is an time expensive procedure but if you have multiple processes this may not be a good strategy. Each process needs to get their memory from the OS and it is therefore vital that each process returns memory once they no longer need it.
Although it is often better to parallelize at a large scale due to initialization costs it may in memory situations be better to parallelize at a small scale, i.e. in subroutines.
I sometimes run code in parallel, cache the results, and once I reach the limit I change to sequential.
You can also manually limit the number of cores, using all the cores is of no use if the memory isn’t large enough. A simple way to think of it is: memory.limit()/memory.size() = max cores
Other tips
A general core detector function that I often use is:
Never useset.seed(), use clusterSetRNGStream() instead, to set the cluster seed if you want reproducible results
If you have a Nvidia GPU-card, you can get huge gains from micro-parallelization through the gputools package (Warning though, the installation can be rather difficult…).
When using mice in parallel remember to use ibind() for combining the imputations.
To leave a comment for the author, please follow the link and comment on his blog: G-Forge » R.
On March 20, Thomas Lumley, the creator of the R Package “Survey”, will give an online course (in statistics.com) titled “Survey Analysis in R”
The purpose of this 4-week online course, is to teach survey researchers who are familiar with R how to use it in survey research. The course uses Lumley’s Survey package. You will learn how to describe to R the design of a survey; both simple and complex designs are covered. You will then learn how to produce descriptive statistics and graphs with the survey data, and also to perform regression analysis on the data. The instructor Thomas Lumley, PHD, is a Professor of Biostatistics at the University of Auckland and an Affiliate Professor at the University of Washington. He has published numerous journal articles in his areas of research interest, which include regression modeling, clinical trials, statistical computing, and survey research. The course requires about 15 hours per week and there are no set hours when you must be online. Participants can ask questions and exchange comments directly with Dr. Lumley via a private discussion board throughout the period.
Although it is reasonable that R scripts get opened in edit mode by default, it would be even nicer (once in a while) to run them with a simple double-click. Well, here we go ...
Choosing a new file extension name (.Rexec)
First, we have to think about a new file extension name. While double-click to run is a nice-to-have, the default behaviour should not be overwritten. In the Windows universe one cannot simply attach two different behaviours to the same file extension but we can register new extensions and associate custom defaults to those. Therefore we need another, new file extension.
To make the file extension as self-explanatory as possible, I suggest using .Rexec for R scripts that should be executable while leaving the default system behaviour for .R files as is.
Associating a new file type with the .Rexec extension
In the next step, we tell Windows that the .Rexec file extension is associated with the RScriptExecutable file type. Furthermore, we inform Windows how these kind of files should be opened by default.
To do so, we need access to the command line interface, e.g., via cmd. Click Start and type cmd into the search bar. Instead of hitting enter right away, right click on the 'cmd.exe' search result, choose Run as administrator from the context menu, and click Yes on the following pop up window. The windows command line should pop up thereafter.
Within the command line, type first:
ASSOC .Rexec=RScriptExecutable
... then ...
FTYPE RScriptExecutable=C:Program FilesRR-3.1.2binx64Rscript.exe %1 %*
... while making sure that the path used above really leads to your most recent/preferred RScript.exe.
Testing
To test if everything works as expected, create an R script and write the following lines:
message(getwd())
for(i in 1:100) {
  cat(".")
  Sys.sleep(0.01)
}
message("nBye.")
Sys.sleep(3)
Save it as, e.g., 'test.Rexec' and double click on the file. Now a black box should pop up, informing you about the current working directory, and printing 100 dots on the screen and terminate itself after saying 'Bye'.
Et voilà.
One more thing (or two)
While you are now able to produce executable R script files, note that it is also very easy to transform those back by simply changing the file extension from .Rexec to .R and vice versa.
If you execute your R scripts from the command line, you might want to save yourself from having to add the file extension every time. Simply register .Rexec as a file extension that is executable. The PATHEXT environment variable stores all executable file types. Either go to: Start > Control Panel > System > Advanced System Settings > Environment Variables and search for the 'PATHEXT' entry under System Variables and add .Rexec to the end of the line like that: '.COM;.EXE;.BAT;.Rexec', or go to the command line again and type:
(This article was first published on Ripples, and kindly contributed to R-bloggers)
Sweet home Alabama, Where the skies are so blue; Sweet home Alabama, Lord, I’m coming home to you (Sweet home Alabama, Lynyrd Skynyrd)
This is the second post I write to show the abilities of twitteR package and also the second post I write for KDnuggets. In this case my goal is to have an insight of what people tweet about american states. To do this, I look for tweets containing the exact phrase “[STATE NAME] is” for every states. Once I have the set of tweets for each state I do some simple text mining: cleaning, standardizing, removing empty words and crossing with these sentiment lexicons. Then I choose the two most common words to describe each state. You can read the original post here. This is the visualization I produced to show the result of the algorithm:
Since the right side of the map is a little bit messy, in the original post you can see a table with the couple of words describing each state. This is just an experiment to show how to use and combine some interesting tools of R. If you don’t like what Twitter says about your state, don’t take it too seriously.
This is the code I wrote for this experiment:
# Do this if you have not registered your R app in Twitter
library(twitteR)
library(RCurl)
setwd("YOUR-WORKING-DIRECTORY-HERE")
if (!file.exists('cacert.perm'))
{
  download.file(url = 'http://curl.haxx.se/ca/cacert.pem', destfile='cacert.perm')
}
requestURL="https://api.twitter.com/oauth/request_token"
accessURL="https://api.twitter.com/oauth/access_token"
authURL="https://api.twitter.com/oauth/authorize"
consumerKey = "YOUR-CONSUMER_KEY-HERE"
consumerSecret = "YOUR-CONSUMER-SECRET-HERE"
Cred <- OAuthFactory$new(consumerKey=consumerKey,
                         consumerSecret=consumerSecret,
                         requestURL=requestURL,
                         accessURL=accessURL,
                         authURL=authURL)
Cred$handshake(cainfo=system.file("CurlSSL", "cacert.pem", package="RCurl"))
save(Cred, file="twitter authentification.Rdata")
# Start here if you have already your twitter authentification.Rdata file
library(twitteR)
library(RCurl)
library(XML)
load("twitter authentification.Rdata")
registerTwitterOAuth(Cred)
options(RCurlOptions = list(cainfo = system.file("CurlSSL", "cacert.pem", package = "RCurl")))
#Read state names from wikipedia
webpage=getURL("http://simple.wikipedia.org/wiki/List_of_U.S._states")
table=readHTMLTable(webpage, which=1)
table=table[!(table$"State name" %in% c("Alaska", "Hawaii")), ]
#Extract tweets for each state
results=data.frame()
for (i in 1:nrow(table))
{
  tweets=searchTwitter(searchString=paste("'"", table$"State name"[i], " is"'",sep=""), n=200, lang="en")
  tweets.df=twListToDF(tweets)
  results=rbind(cbind(table$"State name"[i], tweets.df), results)
}
results=results[,c(1,2)]
colnames(results)=c("State", "Text")
library(tm)
#Lexicons
pos = scan('positive-words.txt',  what='character', comment.char=';')
neg = scan('negative-words.txt',  what='character', comment.char=';')
posneg=c(pos,neg)
results$Text=tolower(results$Text)
results$Text=gsub("[[:punct:]]", " ", results$Text)
# Extract most important words for each state
words=data.frame(Abbreviation=character(0), State=character(0), word1=character(0), word2=character(0), word3=character(0), word4=character(0))
for (i in 1:nrow(table))
{
  doc=subset(results, State==as.character(table$"State name"[i]))
  doc.vec=VectorSource(doc[,2])
  doc.corpus=Corpus(doc.vec)
  stopwords=c(stopwords("english"), tolower(unlist(strsplit(as.character(table$"State name"), " "))), "like")
  doc.corpus=tm_map(doc.corpus, removeWords, stopwords)
  TDM=TermDocumentMatrix(doc.corpus)
  TDM=TDM[Reduce(intersect, list(rownames(TDM),posneg)),]
  v=sort(rowSums(as.matrix(TDM)), decreasing=TRUE)
  words=rbind(words, data.frame(Abbreviation=as.character(table$"Abbreviation"[i]), State=as.character(table$"State name"[i]),
                                   word1=attr(head(v, 4),"names")[1],
                                   word2=attr(head(v, 4),"names")[2],
                                   word3=attr(head(v, 4),"names")[3],
                                   word4=attr(head(v, 4),"names")[4]))
}
# Visualization
require("sqldf")
statecoords=as.data.frame(cbind(x=state.center$x, y=state.center$y, abb=state.abb))
#To make names of right side readable
texts=sqldf("SELECT a.abb,
            CASE WHEN a.abb IN ('DE', 'NJ', 'RI', 'NH') THEN a.x+1.7
            WHEN a.abb IN ('CT', 'MA') THEN a.x-0.5  ELSE a.x END as x,
            CASE WHEN a.abb IN ('CT', 'VA', 'NY') THEN a.y-0.4 ELSE a.y END as y,
            b.word1, b.word2 FROM statecoords a INNER JOIN words b ON a.abb=b.Abbreviation")
texts$col=rgb(sample(0:150, nrow(texts)),sample(0:150, nrow(texts)),sample(0:150, nrow(texts)),max=255)
library(maps)
jpeg(filename = "States In Two Words v2.jpeg", width = 1200, height = 600, quality = 100)
map("state", interior = FALSE, col="gray40", fill=FALSE)
map("state", boundary = FALSE, col="gray", add = TRUE)
text(x=as.numeric(as.character(texts$x)), y=as.numeric(as.character(texts$y)), apply(texts[,4:5] , 1 , paste , collapse = "n" ), cex=1, family="Humor Sans", col=texts$col)
dev.off()
To leave a comment for the author, please follow the link and comment on his blog: Ripples.
RStudio’s code editor includes a set of lightweight Vim key bindings. You can turn these on in Tools | Global Options | Code | Editing:
For those not familiar, Vim is a popular text editor built to enable efficient text editing. It can take some practice and dedication to master Vim style editing but those who have done so typically swear by it. RStudio’s “vim mode” enables the use of many of the most common keyboard operations from Vim right inside RStudio.
As part of the 0.99 preview release, we’ve included an upgraded version of the ACE editor, which has a completely revamped Vim mode. This mode extends the range of Vim key bindings that are supported, and implements a number of Vim “power features” that go beyond basic text motions and editing. These include:
Vertical block selection via Ctrl + V. This integrates with the new multiple cursor support in ACE and allows you to type in multiple lines at once.
Macro playback and recording, using q{register} / @{register}.
Marks, which allow you drop markers in your source and jump back to them quickly later.
A selection of Ex commands, such as :wq and :%s that allow you to perform editor operations as you would in native Vim.
Fast in-file search with e.g. / and *, and support for JavaScript regular expressions.
We’ve also added a Vim quick reference card to the IDE that you can bring up at any time to show the supported key bindings. To see it, switch your editor to Vim mode (as described above) and type :help in Command mode.
Whether you’re a Vim novice or power user, we hope these improvements make the RStudio IDE’s editor a more productive and enjoyable environment for you. You can try the new Vim features out now by downloading the RStudio Preview Release.
To leave a comment for the author, please follow the link and comment on his blog: RStudio Blog.
The foreach package provides simple looping constructs in R, similar to lapply() and friends, and makes it easy execute each element in the loops in parallel. You can find the packages at foreach: Foreach looping construct for R and doParallel.
Tracking progress of parallel computing tasks
Parallel programming can help speed up the total completion time of your project. However, for tasks that take a long time to run, you may wish to track progress of the task, while the task is running.
This seems like a simple request, but seems remarkably hard to achieve. The reason boils down to this:
Each parallel worker is running in a different session of R
In some parallel computing setups, the workers don’t communicate with the initiating process, until the final combining step
So, if it is difficult to track progress directly, what can be done?
It seems to me the typical answer to this question fall into 3 different classes:
Use operating system monitoring tools, i.e. tools external to R.
Print messages to a file (or connection) in each worker, then read from this file, again outside of R
Use specialist back-ends that support this capability, e.g. the Redis database and the doRedis package
This is an area with many avenues of exploration, so I plan to briefly summarize each method and point to at least one question on StackOverflow that may help.
In his answer to this question, Dirk Eddelbuettel mentions that parallel back ends like MPI and PVM have job monitors, such as slurm and TORQUE. However, tools that are simpler to use, like snow do not have monitoring tools. In this case, you be forced to use methods like printing diagnostic messages to a file.
For parallel jobs using the doParallel backend, you can use standard operating system monitoring tools to see if the job is running on multiple cores. For example, in Windows, you can use the "Task Manager" to do this. Notice in the CPU utilization how each core went to maximum once the script started:
Method 2: Print messages to a file (or connection) in each worker, then read from this file, again outside of R
Sometimes it may be sufficient, or desirable, to print status messages from each of the workers. Simply adding a print() statement will not work, since the parallel workers do not share the standard output of the master job.
Steve Weston, the author of foreach (and one of the original founders of Revolution Analytics) wrote an excellent answer to this question.
Steve says that output produced by the snow workers gets thrown away by default, but you can use the makeCluster() argument "outfile" option to change that. Setting outfile to the empty string ("") prevents snow from redirecting the output, often resulting in the output from your print messages showing up on the terminal of the master process.
Steve says: to create and register your cluster with something like:
He continues: Your foreach loop doesn't need to change at all. This works with both SOCK clusters and MPI clusters using Rmpi built with Open MPI. On Windows, you won't see any output if you're using Rgui. If you use Rterm.exe instead, you will. In addition to your own output, you'll see messages produced by snow which can also be useful.
Also note that this solution seems to work with doSnow, but is not supported by the doParallel backend.
Method 3: Use specialist back-ends that support this capability, e.g. the Redis database and the doRedis package
The final approach is a novel idea by Brian Lewis, and uses the Redis database as a parallel back end.
Specifically, the R package rredis allows message passing between R and Redis. The package doRedis allows you to use foreach with redis as the parallel backend. What’s interesting about Redis is that this database allows the user to create queues and each parallel worker fetches jobs from this queue. This allows for a dynamic network of workers, even across different machines.
Post Office Sq. – located in the heart of the financial district.
Charles St. & Cambridge – the first Hubway stop after crossing from Cambridge over Longfellow Bridge.
Tremont St & West – East side of the Boston Common
South Station
Cross St. & Hannover – entrance to North End combing from financial district.
Boylston St & Berkeley – between Copley and the Common.
Stuart St & Charles – Theatre district, just south of the Common.
Boylston & Fairfield – located in front of the Boylston Street entrance to the Pru.
The Esplanade (Beacon St & Arlington) – this stop is on the north end of the Esplanade running along the Charles.
Chinatown Gate Plaza
Prudential at Belvidere
Boston Public Library on Boylston
Boston Aquarium
Newbury Street & Hereford
Government Center
I received great feedback from the last post visualizing crime in Boston, so I’m continuing the Boston-related content.
Data
I used trip-level data, which Hubway has made available here. The data is de-identified, although some bicyclist information is provided – e.g. gender and address zip code of registered riders (there are over 4 times more trips taken by males than females).
I initially wanted to visualize the trips on a city-level map, but dropped the idea after seeing a great post on the arcdiagram package in R. The Hubway system is basically a network where the nodes are bike stations and the edges are trips from one station to another. Arc diagrams are a cool way to visualize networks.
Arc Diagram Interpretation
The arcs represent network edges, or trip routes.
The thickness of the arcs is proportionate to the popularity of the route, as measured by the number of trips taken on that route.
The size of the nodes are proportionate to the popularity of the node, as measured by “degree.” The degree of a node is defined as the number of edges connected to that node.
Data Cleaning
Some of the data was questionable. There were many trips which began and ended in the same station with a trip duration of 2 minutes. There were also trips that lasted for over 10 hours.
I dropped the trips with very low duration (1st duration percentile) and very high duration (99th duration percentile).
There were many trips which began and ended in the same station that were not questionable. I removed these because they were cluttering the arc diagram without adding much value.
I only used data from bicyclists in certain zip codes (see zip_code vector in the code below).
Since the dataset was so massive, I only plotted a random sample of 1000 trips.
Comments on Arcdiagram Package
My one issue with the arcdiagram package is that there is no workaround for very small node labels
Some arc diagrams have arcs both below and above the x-axis. This package doesn’t seem to include this optionality.
install.packages('devtools')
install_github('arcdiagram', username ='gastonstat')
library('devtools')
library(arcdiagram)

input='.../Hubway/hubway_2011_07_through_2013_11'
setwd(input)

zip_code=c('02116','02111','02110','02114','02113','02109')

stations=read.csv('hubway_stations.csv')
trips=read.csv('hubway_trips.csv')

# clean data - there are negative values as well as outrageously huge values
# negative values
trips_2=trips[which(trips$duration>=0),]

# remove clock resets (if trip was less than 6 minutes and start/ended at same station)
p=as.vector(quantile(trips_2$duration,c(.01)))
trips_3=trips_2[which(trips_2$duration>=p1 & trips_2$strt_statn!=trips_2$end_statn),]
# remove outrageously high trips. anything above 99% percentile:
p9=as.vector(quantile(trips_3$duration,c(.99)))
trips_4=trips_3[which(trips_3$duration<=p99),]

# subset to only trips starting/ending in given zip codes
trips_5=trips_4[which(trips_4$zip_code %in% zip_code),]

set.seed(1000)
data=cbind(trips_5$strt_statn,trips_5$end_statn)
samp_n=seq(1,length(data)/2)
samp_set=sample(samp_n,1000,replace=FALSE)
samp=data.frame(data[samp_set,])

# merge on station names
names(samp)=c('id','id2')
m=merge(x=samp,y=stations)
names(samp)=c('id2','id')
m=merge(x=samp,y=stations)

# create sample matrix
samp_w_labels=data.frame(m[,'station'],m2[,'station'])
names(samp_w_labels)=c('start','end')
samp_mat=as.matrix(samp_w_labels)

# delete trips that end where they start
con=paste(samp_mat[,1],samp_mat[,2],sep='')
dup=duplicated(con)
dupp=samp_mat[dup,]
dupp=dupp[which(dupp[,1]!=dupp[,2]),]

# create weights for arcs...weights will by frequency of trips
# each arc represents
clist=data.frame(paste(dupp[,1],dupp[,2],sep=''))
names(clist)=c('clist')
ctab=data.frame(table(clist))
c_m=merge(x=clist,y=ctab)

# create network structure
g=graph.edgelist(dupp, directed=TRUE)
edges=get.edgelist(g)
deg=degree(g)
clus=clusters(g)

# create colors
pal=colorRampPalette(c('darkorchid1','darkorchid4'),bias=5)
colors=pal(length(clus$membership))
node_cols=colors[clus$membership]

# generate arcplot
arcplot(dupp,
 lwd.arcs =.2*c_m$Freq,cex.nodes=.07*deg,
 col.nodes='black',bg.nodes=node_cols, pch.nodes = 21,
 ordering=order(deg,decreasing=TRUE),
 cex.labels=.18,
 horizontal=TRUE)
by Gary R. Moser Director of Institutional Research and Planning The California Maritime Academy
I recently contacted Joseph Rickert about inviting Vim guru Drew Niel (web: vimcasts.org, book: "Practical Vim: Edit Text at the Speed of Thought") to speak at the Bay Area R User Group group. Due to Drew's living in Great Britain that might not be easily achieved, so Joe generously extended an invitation for me to share a bit about why I like Vim here.
When it comes to text editors, there are a number of strong contenders to choose from (...lots and lots of them). if you've found a tool with a rich feature set that makes you more productive (and more importantly, is something you like) you should probably stick with that. Given that editing text of various types is such a big part of our lives, however, it's worth turning a critical eye toward how well our tools facilitate this specific activity.
Do you spend a lot of time editing text? Yeah, me too. Personally this includes R code, Markdown, Latex, as well as notes and outlines (including this article). When I rediscovered Vim fairly recently, it was from the perspective of being a proficient R user. Therefore, my values and beliefs about what constitutes good software are framed by my experience with R. That includes being OK with an initial learning curve.
I have been using RStudio as my primary IDE for R since it was offered. It's great software; they did something not too long ago that I really appreciate - they added a stripped-down Vim editing mode. Vim pushes users to the documentation pretty quickly (usually as the result of accidentally deleting large chunks of work), and as I dug in and began to discover its full functionality, I came to realize how much I was missing out on by using the emulator. The ability to set and jump to marks in a document, or utilizing multiple registers for copy/paste are two good examples of essential but missing features in RStudio.
Vim has been described as "a language for text editing," which I think is a useful way to view it. At the risk of sounding snotty, I would compare the experiences of using Vim (or another good editor) versus a plain-jane text editor to that of playing chess versus checkers. That is, there's an element of strategic and intentional action compared to simply playing one of a limited set of moves over and over again.
One of the things that makes Vim so interesting and different from other editors stems from its origins. As the result of being developed in the context of severe constraints (slow networks, no digital displays, limited system resources, and no mouse), Vim - then "ed" - had to accomplish the greatest amount of work with the least number of keystrokes. This requirement led to the development of a vast number of very specific commands that can be combined in useful ways. Drew Neil artfully compares this to playing notes, chords, and melodies on a piano. It's also an appropriate comparison for setting one's expectations toward becoming a skilled Vim user! Michael Mrozekon's humorous plot cleverly suggests that, not unlike R, Vim doesn't hold your hand.
It also speaks to my point about specificity. Emacs, for example, can be extended to be a web client or music player, hence the rabbit-hole learning curve, but isn't that getting away from the primary task of text editing?
The fundamental way that Vim differs from most other text editors is that it is explicitly modal; all software is technically modal in certain ways (that is, the same keys do different things under different circumstances), but with Vim it is a central design feature. Essentially, what this means is that by switching modes, a different keyboard comes into existence under your fingers. Because Vim has four modes, and a very rich and terse set of key-bindings, it's like having four+ keyboards in one. The keyboard cheat sheet is a useful reference, especially in the beginning.
Warning: after becoming familiar with Vim's basic functionality, going back to a typical text editor feels rather clumsy.
Vim as an interface to R using the Vim-R-plugin is mostly good for how I use it, but I expect to be dialing-in Vim for a long time before it's got all the features I want. I don't mind this, but I can see how someone else might. I encourage you consider your own tools and how well they facilitate your most frequent tasks. If you're an RStudio user, try giving Vim mode a go. A visit to www.vim.org will connect you to the resources you'll need.
To leave a comment for the author, please follow the link and comment on his blog: Revolutions.
The tree-based Cubist model can be easily used to develop an ensemble classifier with a scheme called “committees”. The concept of “committees” is similar to the one of “boosting” by developing a series of trees sequentially with adjusted weights. However, the final prediction is the simple average of predictions from all “committee” members, an idea more close to “bagging”.
Below is a demonstration showing how to use the train() function in the caret package to select the optimal number of “committees” in the ensemble model with cubist, e.g. 100 in the example. As shown, the ensemble model is able to outperform the standalone model by ~4% in a separate testing dataset.
Everybody loves speed comparisons! Is R faster than Python? Is dplyr faster than data.table? Is STAN faster than JAGS? It has been said that speed comparisons are utterly meaningless, and in general I agree, especially when you are comparing apples and oranges which is what I’m going to do here. I’m going to compare a couple of alternatives to lm(), that can be used to run linear regressions in R, but that are more general than lm(). One reason for doing this was to see how much performance you’d loose if you would use one of these tools to run a linear regression (even if you could have used lm()). But as speed comparisons are utterly meaningless, my main reason for blogging about this is just to highlight a couple of tools you can use when you grown out of lm(). The speed comparison was just to lure you in. Let’s run!
The Contenders
Below are the seven different methods that I’m going to compare by using each method to run the same linear regression. If you are just interested in the speed comparisons, just scroll to the bottom of the post. And if you are actually interested in running standard linear regressions as fast as possible in R, then Dirk Eddelbuettel has a nice post that covers just that.
lm()
This is the baseline, the “default” method for running linear regressions in R. If we have a data.framed with the following layout:
This is a generalization of lm() that allows you to assume a number of different distributions for the outcome variable, not just the normal distribution as you are stuck with when using lm(). However, if you don’t specify any distribution glm() will default to using a normal distribution and will produce output identical to lm():
Found in the arm package, this is a modification of glm that allows you to assume custom prior distributions over the coefficients (instead of the implicit flat priors of glm()). This can be super useful, for example, when you have to deal with perfect separation in logistic regression or when you want to include prior information in the analysis. While there is bayes in the function name, note that bayesglm() does not give you the whole posterior distribution, only point estimates. This is how to run a linear regression with flat priors, which should give similar results as when using lm():
While lm() can only fit linear models, nls() can also be used to fit non-linear models by least squares. For example, you could fit a sine curve to a data set with the following call: nls(y ~ par1 + par2 * sin(par3 + par4 * x )). Notice here that the syntax is a little bit different from lm() as you have to write out both the variables and the parameters. Here is how to run the linear regression:
In the bblme package we find mle2(), a function for general maximum likelihood estimation. While mle2() can be used to maximize a handcrafted likelihood function, it also has a formula interface which is simple to use, but powerful, and that plays nice with R’s built in distributions. Here is how to roll a linear regression:
Note, that we need to explicitly initialize the parameters before the maximization and that we now also need a parameter for the standard deviation. For an even more versatile use of the formula interface for building statistical models, check out the very cool rethinking package by Richard McElreath.
optim()
Of course, if we want to be really versatile, we can craft our own log-likelihood function to maximized using optim(), also part of base R. This gives us all the options, but there are also more things that can go wrong: We might make mistakes in the model specification and if the search for the optimal parameters is not initialized well the model might not converge at all! A linear regression log-likelihood could look like this:
As the convergence returned 0 it hopeful worked fine (a 1 indicates non-convergence). The control = list(fnscale = -1) argument is just there to make optim() do maximum likelihood estimation rather than minimum likelihood estimation (which must surely be the worst estimation method ever).
Stan’s optimizing()
Stan is a stand alone program that plays well with R, and that allows you to specify a model in Stan’s language which will compile down to very efficient C++ code. Stan was originally built for doing Hamiltonian Monte Carlo, but now also includes an optimizing() function that, like R’s optim(), allows you to do maximum likelihood estimation (or maximum a posteriori estimation, if you explicitly included priors in the model definition). Here we need to do a fair bit of work before we can fit a linear regression but what we gain is extreme flexibility in extending this model, would we need to. We have come a long way from lm…
library(rstan)
## Loading required package: inline## ## Attaching package: 'inline'## ## The following object is masked from 'package:Rcpp':## ## registerPlugin## ## rstan (Version 2.6.0, packaged: 2015-02-06 21:02:34 UTC, GitRev: 198082f07a60)## ## Attaching package: 'rstan'## ## The following object is masked from 'package:arm':## ## traceplot
model_string <-"data { int n; vector[n] y; vector[n] x1; vector[n] x2;}parameters { real intercept; real beta1; real beta2; real<lower=0> sigma;}model { vector[n] mu; mu <- intercept + x1 * beta1 + x2 * beta2; y ~ normal(mu, sigma);}"
data_list <- list(n = nrow(d), y = d$y, x1 = d$x1, x2 = d$x2)
model <- stan_model(model_code = model_string)
fit <- optimizing(model, data_list)
fit
So, just for fun, here is the speed comparison, first for running a linear regression with 1000 data points and 5 predictors:
This should be taken with a huge heap of salt (which is not too good for your health!). While all these methods produce a result equivalent to a linear regression they do it in different ways, and not necessary in equally good ways, for example, my homemade optim routine is not converging correctly when trying to fit a model with too many predictors. As I have used the standard settings there is surely a multitude of ways in which any of these methods can be made faster. Anyway, here is what happens if we vary the number of predictors and the number of data points:
To make these speed comparisons I used the microbenchmark package, the full script replicating the plots above can be found here. This speed comparison was made on my laptop running R version 3.1.2, on 32 bit Ubuntu 12.04, with an average amount of RAM and a processor that is starting to get a bit tired.
To leave a comment for the author, please follow the link and comment on his blog: Publishable Stuff.
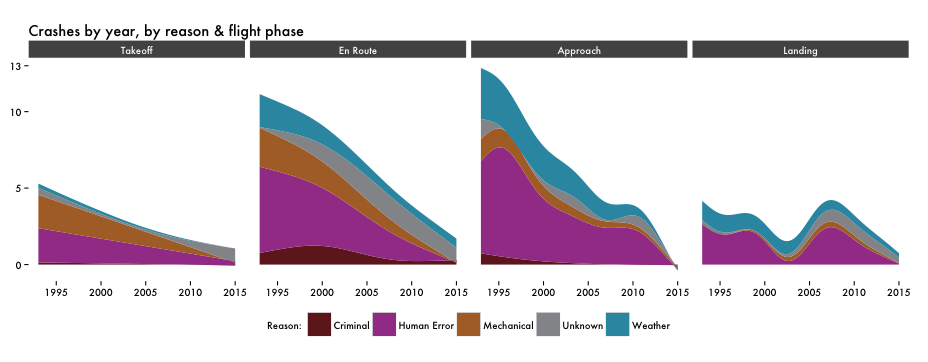
Over on The DO Loop, @RickWicklin does a nice job visualizing the causes of airline crashes in SAS using a mosaic plot. More often than not, I find mosaic plots can be a bit difficult to grok, but Rick’s use was spot on and I believe it shows the data pretty well, but I also thought I’d take the opportunity to:
As I mentioned, @jennybc made a really nice package to interface with Google Sheets, and the IIB site makes the data available, so I copied it to my Google Drive and gave her package a go:
library(googlesheets)library(ggplot2)# we'll need the rest of the libraries laterlibrary(dplyr)# but just getting them out of the waylibrary(tidyr)# this will prompt for authentication the first time
my_sheets <- list_sheets()# which one is the flight data onegrep("Flight", my_sheets$sheet_title, value=TRUE)## [1] "Copy of Flight Risk JSON" "Flight Risk JSON" # get the sheet reference then the data from the second tab
flights <- register_ss("Flight Risk JSON")
flights_csv <- flights %>% get_via_csv(ws ="93-2014 FINAL")# take a quick look
glimpse(flights_csv)## Observations: 440## Variables:## $ date (chr) "d", "1993-01-06", "1993-01-09", "1993-01-31", "1993-02-08", "1993-02-28", "...## $ plane_type (chr) "t", "Dash 8-311", "Hawker Siddeley HS-748-234 Srs", "Shorts SC.7 Skyvan 3-1...## $ loc (chr) "l", "near Paris Charles de Gualle", "near Surabaya Airport", "Mt. Kapur", "...## $ country (chr) "c", "France", "Indonesia", "Indonesia", "Iran", "Taiwan", "Macedonia", "Nor...## $ ref (chr) "r", "D-BEAT", "PK-IHE", "9M-PID", "EP-ITD", "B-12238", "PH-KXL", "LN-TSA", ...## $ airline (chr) "o", "Lufthansa Cityline", "Bouraq Indonesia", "Pan Malaysian Air Transport"...## $ fat (chr) "f", "4", "15", "14", "131", "6", "83", "3", "6", "2", "32", "55", "132", "4...## $ px (chr) "px", "20", "29", "29", "67", "22", "56", "19", "22", "17", "38", "47", "67"...## $ cat (chr) "cat", "A1", "A1", "A1", "A1", "A1", "A1", "A1", "A1", "A2", "A1", "A1", "A1...## $ phase (chr) "p", "approach", "initial_climb", "en_route", "en_route", "approach", "initi...## $ cert (chr) "cert", "confirmed", "probable", "probable", "confirmed", "probable", "confi...## $ meta (chr) "meta", "human_error", "mechanical", "weather", "human_error", "weather", "h...## $ cause (chr) "cause", "pilot & ATC error", "engine failure", "low visibility", "pilot err...## $ notes (chr) "n", NA, NA, NA, NA, NA, NA, NA, NA, NA, NA, NA, NA, NA, NA, NA, NA, NA, NA,...# the spreadsheet has a "helper" row for javascript, so we nix it
flights_csv <- flights_csv[-1,]# js vars removal# and we convert some columns while we're at it
flights_csv %>%
mutate(date=as.Date(date),
fat=as.numeric(fat),
px=as.numeric(px))-> flights_csv
A Bit of Cleanup
Despite being a spreadsheet, the data needs some cleanup and there’s no real need to include “grounded” or “unknown” in the flight phase given the limited number of incidents in those categories. I’d actually mention that descriptively near the visual if this were anything but a blog post.
The area chart also needs full values for each category combo per year, so we use expand from tidyr with left_join and mutate to fill in the gaps.
I probably took some liberties lumping “climb” in with “takeoff”, but I’d’ve asked an expert for a production piece just as I would hope folks doing work for infosec reports or visualizations would consult someone knowledgable in cybersecurity.
The Final Plot
I’m a big fan of an incremental, additive build idiom for ggplot graphics. By using the gg <- gg + … style one can move lines around, comment them out, etc without dealing with errant + signs. It also forces a logical separation of ggplot elements. Personally, I tend to keep my build orders as follows:
main ggplot call with mappings if the graph is short, otherwise add the mappings to the geoms
all geom_ or stat_ layers in the order I want them, and using line breaks to logically separate elements (like aes) or to wrap long lines for easier readability.
all scale_ elements in order from axes to line to shape to color to fill to alpha; I’m not as consistent as I’d like here, but keeping to this makes it really easy to quickly hone in on areas that need tweaking
facet call (if any)
label setting, always with labs unless I really have a need for using ggtitle
base theme_ call
all other theme elements, one per gg <- gg + line
I know that’s not everyone’s cup of tea, but it’s just how I roll ggplot-style.
For this plot, I use a smoothed stacked plot with a custom smoother and also use Futura Medium for the text font. Substitute your own fav font if you don’t have Futura Medium.
with the facets ordered by takeoff, flying, approaching landing and actual landing phases. Overall, things have gotten way better, though I haven’t had time to look in to the bump between 2005 and 2010 for landing crashes.
As an aside, Boeing has a really nice PDF on some of this data with quite a bit more detail.
To leave a comment for the author, please follow the link and comment on his blog: rud.is » R.
The annoucement below just went to the R-SIG-Finance list. More information is as usual at the R / Finance page.
Registration for R/Finance 2015 is now open!
The conference will take place on May 29 and 30, at UIC in Chicago. Building on the success of the previous conferences in 2009-2014, we expect more than 250 attendees from around the world. R users from industry, academia, and government will joining 30+ presenters covering all areas of finance with R.
We are very excited about the four keynote presentations given by Emanuel Derman, Louis Marascio, Alexander McNeil, and Rishi Narang. The conference agenda (currently) includes 18 full presentations and 19 shorter "lightning talks". As in previous years, several (optional) pre-conference seminars are offered on Friday morning.
There is also an (optional) conference dinner at The Terrace at Trump Hotel. Overlooking the Chicago river and skyline, it is a perfect venue to continue conversations while dining and drinking.
The conference will take place on May 29 and 30, at UIC in Chicago. Building on the success of the previous conferences in 2009-2014, we expect more than 250 attendees from around the world. R users from industry, academia, and government will joining 30+ presenters covering all areas of finance with R.
We are very excited about the four keynote presentations given by Emanuel Derman, Louis Marascio, Alexander McNeil, and Rishi Narang. The main agenda (currently) includes 18 full presentations and 19 shorter "lightning talks". As in previous years, several (optional) pre-conference seminars are offered on Friday morning.
There is also an (optional) conference dinner that will once-again be held at The Terrace at Trump Hotel. Overlooking the Chicago river and skyline, it is a perfect venue to continue conversations while dining and drinking.
We would to thank our 2015 sponsors for the continued support enabling us to host such an exciting conference:
I have written a several posts about the Parallel External Memory Algorithms (PEMAs) in Revolution Analytics’ RevoScaleR package, most recently about rxBTrees(), but I haven’t said much about rxExec(). rxExec() is not itself a PEMA, but it can be used to write parallel algorithms. Pre-built PEMAs such as rxBTrees(), rxLinMod(), etc are inherently parallel algorithms designed for distributed computing on various kinds of clusters: HPC Server,Platform LSF and Hadoop for example. rxExec()’s job, however, is to help ordinary, non-parallel functions run in parallel computing or distributed computing environments.
To get a handle on this, I think the best place to start is with R’s foreach() function which enables an R programmer to write “coarse grain”, parallel code. To be concrete, suppose we want to fit a logistic regression model to two different data sets. And to speed things up, we would like to do this in parallel. Since my laptop has two multi-threaded cores, this a straight-forward use case to prototype. The following code points to two of the multiple csv files that comprise the mortgageDefault data set available at Revolution Analytics’ data set download site.
#----------------------------------------------------------# load needed libraries#----------------------------------------------------------library(foreach)#----------------------------------------------------------# Point to the Data#----------------------------------------------------------
dataDir <-"C:\DATA\Mortgage Data\mortDefault"
fileName1 <-"mortDefault2000.csv"
path1 <-file.path(dataDir,fileName1)
fileName2 <-"mortDefault2001.csv"
path2 <-file.path(dataDir,fileName2)#----------------------------------------------------------# Look at the first data filesystem.time(data1 <-read.csv(path1))#user system elapsed #2.52 0.02 2.55dim(data1)head(data1,3)#creditScore houseAge yearsEmploy ccDebt year default#1 615 10 5 2818 2000 0#2 780 34 5 3575 2000 0#3 735 12 1 3184 2000 0
Note that it takes almost 3 seconds to read one of these files into a data frame.
The following function will read construct the name and path of a data set from parameters supplied to it, reads the data into a data frame and then uses R’s glm() function to fit a logistic regression model.
#----------------------------------------------------------- # Function to read data and fit a logistic regression#-----------------------------------------------------------
glmEx <-function(directory,fileStem,fileNum,formula){
fileName <-paste(fileStem,fileNum,".csv",sep="")
path <-file.path(directory,fileName)data<-read.csv(path)
model <-glm(formula=formula,data=data,family=binomial(link="logit"))return(summary(model))}
form <-formula(default ~ creditScore + houseAge + yearsEmploy + ccDebt)
Something like this might be reasonable if you had a whole bunch of data sets in a directory. To process the two data sets in parallel we set up and internal cluster with 2 workers, register the parallel backend and run foreach() with the %dopar% operator.
#----------------------------------------------------------# Coarse grain parallelism with foreach #----------------------------------------------------------
cl <- makePSOCKcluster(2)# Create copies of R running in parallel and communicating over sockets.# My laptop has 2 multi threaded cores
registerDoParallel(cl)#register parallel backendsystem.time(res <-foreach(num = c(2000,2001)) %dopar%
glmEx(directory=dataDir,fileStem="mortDefault",fileNum=num,formula=form)) #user system elapsed #5.34 1.99 43.54
stopCluster(cl)
The basic idea is that my two-core PC processes the two data sets in parallel. The whole thing runs pretty quickly: two logit models are fit on a million rows each in about 44 seconds.
Now, the same process can be accomplished with rxExec() as follows:
#-----------------------------------------------------------# Coarse grain parallelism with rxExec#-----------------------------------------------------------
rxOptions(numCoresToUse=2)
rxSetComputeContext("localpar")# use the local parallel compute context
rxGetComputeContext()
argList2 <-list(list(fileNum=2000),list(fileNum=2001))system.time(res <- rxExec(glmEx,directory=dataDir,fileStem="mortDefault",formula=form,elemArgs=argList2)) #user system elapsed #4.85 2.01 45.54
First notice that rxExec() took about the same amount of time to run. This is not surprising since, under the hood, rxExec() looks a lot like foreach() (while providing additional functionality). Indeed, the same Revolution Analytics team worked on both functions.
You can also see that rxExec() looks a bit like an apply() family function in that it takes a function, in this case my sample function glmEx(), as one of its arguments. The elemArgs parameter takes a list of arguments that will be different for constructing the two file names, while the other arguments separated by commas in the call statement are parameters that are the same for both. With this tidy syntax we could direct the function to fit models that are located in very different locations and also set different parameters for each glm() call.
The really big difference between foreach() and rxExec(), however, is the line
rxSetComputeContext("localpar")
which sets the compute context. This is the mechanism that links rxExec() and pre-built PEMA’s to RevoScaleR’s underlying distributed computing architecture. Changing the the compute context allows you to run the R function in the rxExec() call on a cluster. For example, in the simplest case where you can log into an edge node on a Hadoop cluster, the following code would enable rxExec() to run the glmEx() function on each node of the cluster.
myHadoopContext <- RxHadoopMR()
rxSetComputeContext(myHadoopContext)
In a more complicated scenario, for example where you are remotely connecting to the cluster, it will be necessary to include your credentials and some other parameters in the statement that specifies the compute context.
Finally, we can ratchet things up to a higher level of performance by using a PEMA in the rxExec() call. This would make sense in a scenario where you want to fit a different model one each node of a cluster while making sure that you are getting the maximum amount of parallel computation from all of the cores on each node. The following new version of the custom glm function uses the RevoScaleR PEMA rxLogit() to fit the logistic regressions:
----------------------------------------------------------# Finer parallelism with rxLogit#----------------------------------------------------------
glmExRx <-function(directory,fileStem,fileNum,formula){
fileName <-paste(fileStem,fileNum,".csv",sep="")
path <-file.path(directory,fileName)data<-read.csv(path)
model <- rxLogit(formula=formula,data=data)return(summary(model))}
argList2 <-list(list(fileNum=2000),list(fileNum=2001))system.time(res <- rxExec(glmExRx,directory=dataDir,fileStem="mortDefault",formula=form,elemArgs=argList2)) #user system elapsed #0.01 0.00 8.33
Here, still running just locally on my laptop, we see quite an improvement in performance. The computation runs in about 8.3 seconds. (Remember that over two seconds of this elapsed time is devoted to reading the data.). Some of this performance improvement comes from additional, “finer grain” parallelism of the rxLogit() function. Most of the speedup, however, is likely due to careful handling of the underlying matrix computations.
In summary, rxExec() can be thought of as an extension of foreach() that is capable of leveraging all kinds of R functions in distributed computing environments.
To leave a comment for the author, please follow the link and comment on his blog: Revolutions.
In February the WSJ graphics team put together a series of interactive visualisations on the impact of vaccination that blew up on twitter and facebook, and were roundly lauded as great-looking and effective dataviz. Some of these had enough data available to look particularly good, such as for the measles vaccine:
Credit to the WSJ and creators: Tynan DeBold and Dov Friedman
How hard would it be to recreate an R version?
Base R version
Quite recently Mick Watson, a computational biologist based here in Edinburgh, put together a base R version of this figure using heatmap.2 from the gplots package.
If you’re interested in the code for this, I suggest you check out his blog post where he walks the reader through creating the figure, beginning from heatmap defaults.
However, it didn’t take long for someone to pipe up asking for a ggplot2 version (3 minutes in fact…) and that’s my preference too, so I decided to have a go at putting one together.
ggplot2 version
Thankfully the hard work of tracking down the data had already been done for me, to get at it follow these steps:
It’s a bit crude but what I’m doing is summing the weekly incidence rates and leaving NAs if there’s no data for a whole year. This seems to match what’s been done in the WSJ article, though a more intepretable method could be something like average weekly incidence, as used by Robert Allison in his SAS version.
After trying to match colours via the OS X utility “digital colour meter” without much success, I instead grabbed the colours and breaks from the original plot’s javascript to make them as close as possible.
In full, the actual ggplot2 command took a fair bit of tweaking:
I’m pretty happy with the outcome but there are a few differences: the ordering is out (someone pointed out the original is ordered by two letter code rather than full state name) and the fonts are off (as far as I can tell they use “Whitney ScreenSmart” among others).
Obviously the original is an interactive chart which works great with this data. It turns out it was built with the highcharts library, which actually has R bindings via the rCharts package, so in theory the original chart could be entirely recreated in R! However, for now at least, that’ll be left as an exercise for the reader…


 Nothing has gotten more attention in the visualization world like the map-based insights, or in other words, just plotting on a map different KPIs to allow for a playful discovery experience. I must admit, maps are cool, an awesome tool to “show-off” and to visually gain some insights.